Structure-based drug design and its clinical record
· 18 min read
Digests are written primarily by LLMs with only readability edits by me. If this one reads like slop, please shoot me an email at max.zhuang@berkeley.edu.
For about thirty years, KRAS was a textbook undruggable target. Its mutations drive several common cancers, its biology was extensively studied, and crystal structures of Ras proteins had been in the Protein Data Bank since the late 1980s.
Regardless, those structures were not enough. The KRAS protein binds guanosine triphosphate (GTP) with very high affinity. That high affinity meant competing at that site was difficult, and the published structures showed an “undruggable target”; there was no discernable pocket that a drug could occupy.
Almost spitefully, however, the pocket was found in 2013, and not from a better structure. Ostrem and colleagues in Kevan Shokat’s lab used covalent fragment screening, tethering candidate molecules to the cysteine that the G12C mutation introduces, and found compounds that stuck. When they crystallized those complexes they discovered a pocket beneath the switch-II region that, in their words, “is not apparent in other published structures of Ras.” Chemistry found the pocket and crystallography showed everyone where it was. Six years later, Amgen and Mirati optimized their own compounds against crystal structures of KRAS-bound compounds: Amgen’s structures found a second small pocket, which yielded the scaffold that eventually became sotorasib.
In the randomized trial that was supposed to confirm sotorasib’s benefit in previously treated, advanced KRAS G12C-mutated non-small-cell lung cancer, median progression-free survival was 5.6 months against 4.5 for chemotherapy, a difference of about a month, with no demonstrated overall survival benefit. Five years after US accelerated approval, that indication remains awaiting confirmation of benefit. FDA reviewers also questioned potential bias in the trial.
What does knowing a protein’s shape let a developer decide, and what remains open after they know it? KRAS had a known structure for decades before a drug arrived. Experiments revealed the useful pocket; clinical trials still have to establish how much patients benefit.
This digest focuses on small molecules, with a short section on designed biologics. It covers experimental structures, predicted structures, generative chemistry and clinical pipelines, whose results are often bundled together under “AI drug discovery.”
What a structure answers, and what it does not
A drug program has to get several different things right, and structural information bears on them very unevenly.
Shape. Where are the atoms? Experiments use X-ray crystallography, cryo-electron microscopy or nuclear magnetic resonance; computational methods include AlphaFold and its relatives.
Pose. Given the shape, where does a particular small molecule sit, and in what orientation? Docking programs answer this, and so do co-folding models that place protein and ligand together.
Affinity. How tightly does it bind, precisely enough to choose between candidates? Free energy perturbation is the physics-based approach; machine-learned scoring functions are cheaper to compute.
Three further questions require evidence beyond a structure:
Cellular action and selectivity. Does the compound engage the target inside a living cell at a useful concentration, and does it avoid harmful effects on other proteins?
Exposure and therapeutic window. Does enough drug reach the tissue for long enough, and is there a gap between the dose that works and the dose that harms?
Clinical benefit. Does engaging this target in these patients change the disease?
A potent compound may require an intolerable dose to reach the relevant tissue. A selective probe can help test whether a target matters in disease. Either result can send a program back to its chemistry.
Structure and binding
Biology and patients
Results change the next decision. Cellular and exposure findings guide revised molecules; clinical findings can revise the target hypothesis.
Structure in three drug programs
Zanamivir: structure originated the molecule
Peter Colman and Jose Varghese solved influenza neuraminidase in 1983. Mark von Itzstein’s group used those structures to identify a negatively charged region adjacent to a hydroxyl group on a known weak inhibitor, and reasoned that placing a positive charge there would bind much more tightly. It did: the guanidino compound gained roughly a thousand-fold. The 1993 paper records the design decision.
The remaining challenge was delivery. Zanamivir has low oral bioavailability and was approved as an inhaled powder.
Captopril: the molecule arrived without the structure
Captopril is still described in the peer-reviewed literature as the first structure-based drug. Ondetti and Cushman designed it in the mid-1970s from what their own paper calls “a hypothetical model of the active site,” built by analogy to a different enzyme, carboxypeptidase A. The first crystal structure of angiotensin-converting enzyme appeared in 2003, twenty-two years after approval, and the paper reporting it notes that these inhibitors “were developed without knowledge of the structure of human ACE” and that the enzyme “bears little similarity” to the one they had reasoned from.
Darunavir: structure informed a resistance hypothesis
Darunavir’s developers used structural comparisons to help design a drug that would retain activity against drug-resistant HIV. Their account of the development connects that rationale with experimental resistance testing and the subsequent clinical program.
Some of the useful chemistry came before the explanation for why it should work. Structural reasoning helped develop it further.
Documenting structure’s contribution
Was a structure available? Was it used? Did it change a design decision? Public deposition dates answer only the first. Industrial teams may hold structures for years before depositing them, so the public chronology below cannot establish everything a company knew.
| Drug | Structural evidence | Documented contribution and limit |
|---|---|---|
| Zanamivir | Experimental target structure before design | Informed the inhibitor hypothesis; delivery still required separate development |
| Darunavir | Structures used during development | Informed resistance-focused design; chemistry and clinical testing remained essential |
| Venetoclax | Structural guidance during optimization | Improved selectivity over an earlier compound; the earlier program’s platelet toxicity motivated the change |
| Sotorasib | Experimental complexes revealed useful interactions | Guided optimization after fragment screening; clinical benefit still needed demonstration |
| Imatinib | Kinase complex reported after the molecule entered trials | Explained an already-observed selectivity, providing information useful to later design |
| Captopril | Target structure determined after approval | Discovery used a mechanistic analogy; a target crystal structure was not required |
Burley and colleagues classify 34 small-molecule cancer approvals from 2019–2023 as 18 yes, 10 probable, 4 possible and 2 unlikely, and report that in 28 of 34 cases, about 82%, there is “either direct or indirect evidence” of structure-guided lead optimization. Their “probable” category is satisfied if the PDB held a structure of the target ten or more years before approval, among other criteria, or if a competitor had used structural methods on that target. That does not document a design decision by the team that developed the drug.
Tests of predicted structures
AlphaFold2’s release in 2021 made a structural model available for almost any protein.
For shape, predicted structures help a great deal, and the gain is measurable, mostly inside structural biology. Molecular replacement is the standard way to solve a new crystal structure using a known related one; when nothing similar exists, crystallographers fall back on slower experimental phasing. Simpkin and colleagues took 406 structures that had historically required that fallback and found that 87.7% now solve first-pass with AlphaFold2 models, 97% in total, with only about 3% still needing experimental phasing.
Prediction also opened targets that were not otherwise accessible. The trace amine-associated receptor TAAR1 had no experimental structure when Shoichet’s collaborators docked 16 million molecules against an AlphaFold2 model; the hit rate was 60% against 22% for a homology model, and one compound produced the expected pharmacology in wild-type mice and not in mice lacking the receptor, a control supporting a target-dependent effect.
For ligand discovery, prospective screens show a practical benefit. Lyu and colleagues ran large prospective screens against AlphaFold2 models and against experimental structures of the same two targets, synthesizing and testing hundreds of compounds. Hit rates were statistically indistinguishable: 54% versus 51% for the σ2 receptor, 26% versus 23% for 5-HT2A. The two campaigns also found different chemistry. Of 134 new σ2 ligands, only one shared a core scaffold across the two arms, with average fingerprint similarity near random; for 5-HT2A no two actives shared a scaffold. Three of the top five agonists from the predicted structure were subtype selective, and none of those from the experimental structure were. A predicted structure gave access to useful chemistry that the experimental-structure campaign had not found.
Choosing a usable predicted structure in advance remains difficult. The authors’ binding-site confidence scores suggested a possible way to rank suitability, but they did not establish a generally reliable selection rule. At the serotonin receptor, the functional hit rate was only 1–5%: binding did not necessarily produce the desired activity. That limitation applied to both structure sources.
Pose reconstruction tests a different capability. Škrinjar and colleagues assembled 2,600 protein-ligand systems released after the evaluated co-folding models’ training cutoffs. They grouped them by similarity to training examples, using a combination of binding-pocket coverage and three-dimensional ligand overlap. Success falls steeply as similarity falls: in the least-similar bin AlphaFold3 succeeds on roughly 15% of systems, against roughly half at high similarity. These are approximate readings from their figure. Across the dataset as a whole, the protein pocket is modelled well in about 90% of cases. They conclude that these models “largely memorize ligand poses from their training data.”
A screening campaign can find useful molecules without reconstructing every known pose correctly. These studies also use different models and targets; they are not a controlled comparison.
In a study of 253 G-protein-coupled receptor complexes, Zhang and colleagues found that sequence identity and ligand fingerprint similarity were not reliable predictors of individual pose accuracy. Their main Boltz-1x evaluation reached 37.2% success for the highest-ranked pose at a positional-error threshold of 2.5 ångströms (0.25 nanometres). Those similarity measures differ from Škrinjar’s combined measure. The same paper also found that Boltz-2’s gains were concentrated in cases newly included in training.
| Test | Models and scope | What success means |
|---|---|---|
| Prospective ligand discovery | AlphaFold2 plus docking, two selected receptors | A tested compound binds; functional activity is a separate measurement |
| Pose reconstruction | Co-folding models, 2,600 protein–ligand systems | A predicted ligand pose matches its experimental position |
Affinity predictions and compound selection
“Not good enough” is meaningless without a task. Choosing which hundred compounds to make, separating two nearly equal candidates, and replacing an assay are three different jobs with three different accuracy requirements.
An assessment involving fifteen pharmaceutical companies tested an OpenFE free energy protocol across 95 systems and more than 1,700 ligands and found root-mean-square errors of 1.73 kcal/mol on public targets and 2.44 on proprietary ones. These energy units quantify errors in predicted binding strength. The same work reports sign accuracy of 80–90% when two compounds differ by one to two orders of magnitude in potency, falling to roughly chance below about 1.5 kcal/mol.
That accuracy may be useful for broad triage, but gives little help choosing between closely matched candidates.
In a 2019 presentation on Merck KGaA programs, Schindler and colleagues reported an average Kendall rank correlation of 0.35 and root-mean-square error of 1.67 kcal/mol. Rank correlation measures agreement about which compounds bind more strongly. In one example, a workflow combining chemical proposals, filtering and free energy calculations selected eight compounds for synthesis; the best improved measured affinity roughly 250-fold over the starting fragment.
The calculations were one part of that workflow; the example cannot tell us how much they contributed or saved. These figures come from the presentation, not the group’s later journal dataset.
Boltz-2 is reported to approach free energy perturbation accuracy at roughly a thousandth of the compute in the authors’ comparison. Its accuracy comparison includes a four-target subset of 87 molecules where it reaches a Pearson correlation of 0.66 against 0.78 for FEP+, a commercial free energy tool; on the larger OpenFE set it reaches 0.62.
A separate evaluation over tens of thousands of compounds found correlations of 0.24 and 0.45 against a physics-based method and near-zero agreement among each method’s top 100. These were comparisons between predictors. The group behind the study develops the physics-based method and used compound sets generated in a loop driven by that method. On the paper’s one comparison against experimental data, the machine-learned model did better than the physics-based method.
A June 2026 preprint by Mattsson and Walters argues that these benchmarks leak through target mirroring: homologous proteins with low sequence identity still have correlated binding profiles, so a model can score well without using structure at all. Their structure-blind baseline, which sees only molecular fingerprints and a target label, ties Boltz-2 exactly on the small benchmark where the FEP comparison was declared, and falls well short of it on the larger one. Their criticism concerns the benchmarks. As of September 2026, I found no published evaluation of Boltz-2 or IsoDDE on their proposed high-novelty split.
Isomorphic Labs’ February 2026 report claims affinity performance above FEP+ and Boltz-2, and more than twice AlphaFold3’s pose accuracy in the hardest Runs N’ Poses similarity category. The pose result would be a substantial improvement on unfamiliar systems. Outside researchers cannot rerun these comparisons: the company has released neither model weights nor code, and offers no public API.
One reason for caution is that on standard benchmarks, models with the protein deleted entirely perform comparably to models that see it, and a ligand-only nearest-neighbour lookup is competitive with trained networks.
Better structural input does not always improve scoring. In the 2024 Critical Assessment of Structure Prediction (CASP16), organizers ran a second stage in which predictors were given the experimental complex structures, including the ligand poses, for five protein systems. The submitted affinity predictions did not improve. The assessors identified scoring functions as the limiting factor for the tested methods, while noting that simulation-based free-energy approaches might respond more to improved poses.
Rentosertib’s clinical program
Insilico Medicine’s target-discovery platform nominated TNIK for idiopathic pulmonary fibrosis, and its generative chemistry platform produced rentosertib. This was structure-based, but it was not a test of structure prediction: the published method used experimental crystal structures. The paper reports roughly 18 months from target discovery to preclinical candidate. Availability of crystal structures was one of the target-selection criteria.
The Phase IIa trial randomized 71 patients across 21 sites in China for 12 weeks. Its primary endpoint was the rate of treatment-emergent adverse events. Forced vital capacity, the volume of air a person can forcibly exhale after a full breath, was secondary. The analysis adjusted for baseline measurements and estimated missing observations. Changes were −20.3 mL for placebo, −27.0 mL for 30 mg once daily, +19.7 mL for 30 mg twice daily, and +98.4 mL for 60 mg once daily. The published confidence intervals describe changes within each arm; the paper does not report a between-arm estimate for this endpoint. The trial was not powered for efficacy. The two regimens totaling 60 mg per day had different numerical results, so this is not a simple comparison of three ascending daily doses.
Severe and serious events were more common in the higher-dose regimens, including liver enzyme elevation and acute exacerbations of the underlying disease. These all-cause events are not interchangeable with events assessed as treatment-related; concomitant therapy complicates attribution of some liver events. The company’s listing prospectus discloses that a separate US Phase IIa trial was placed on clinical hold in May 2025 and released in October 2025, a period spanning publication of the Chinese trial and its surrounding coverage.
A Phase III trial began in September 2026. Its efficacy remains unestablished.
Clinical progression across AI drug programs
A 2024 analysis by Jayatunga and colleagues at Boston Consulting Group reported AI-discovered molecules succeeding in Phase I at 80–90% and in Phase II at about 40%.
The counts are small. The figures reconstruct to 21 of 24 resolved Phase I assets and 4 of 10 resolved Phase II assets in the supplementary tables. Wilson 95% confidence intervals, calculated from those counts, are 69.0–95.7% and 16.8–68.7%. These describe sampling uncertainty; they do not correct disclosure bias or differences between programs. The Phase II interval contains all three historical reference rates shown below, allowing both improvement and deterioration.
The cohort is defined by self-description. Inclusion starts with companies whose websites emphasize a central role for AI. Each asset is assigned a single AI category based on how the company positions its technology. Eleven assets in the supplementary outcome tables are repurposed existing drugs. Three of the 24 resolved Phase I assets were classified as novel-target assets; target status was unspecified for six. Two of the four Phase II successes are repurposed compounds.
The endpoints include progression decisions. Ten of the 21 Phase I successes were recorded within combined Phase I/II trials. The classification could depend on selecting a Phase II dose or starting that portion of the trial. Three of the six Phase II non-successes stopped for business reprioritization or site-activation delays rather than efficacy. Dose, exposure, safety and patient selection matter in both phases, as the FDA’s definitions make clear; commercial decisions can end a program in either.
The comparators are reference cohorts, not controls. Historical estimates differ in indication mix, calendar period, modality, unit of analysis and treatment of ongoing programs.
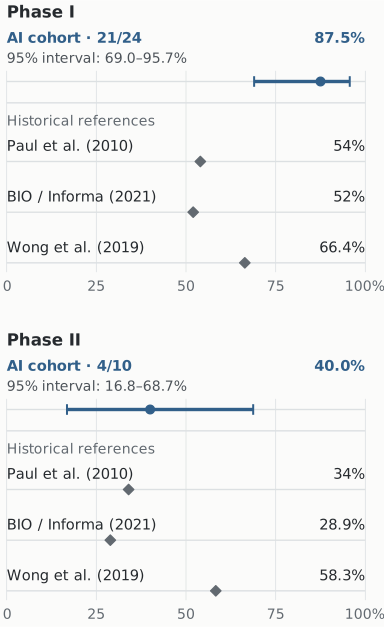
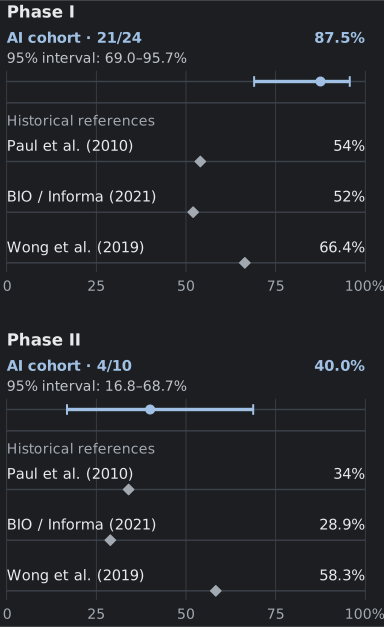
Chart data and sources
| Cohort / reference | Phase I | Phase II |
|---|---|---|
| AI cohort (2024) | 21 / 24 · 87.5% 95% CI: 69.0–95.7% | 4 / 10 · 40.0% 95% CI: 16.8–68.7% |
| Paul et al. (2010) | 54% | 34% |
| BIO / Informa (2021) | 52% | 28.9% |
| Wong et al. (2019) | 66.4% | 58.3% |
A separate census presented at the American Society of Clinical Oncology’s June 2026 meeting describes 117 AI-enabled assets across 63 companies, 82% of them small molecules. As of December 2025, only eight had completed Phase II. The abstract reports no success rates. Its eight completed assets cannot serve as the denominator for Jayatunga’s estimate, which uses different inclusion rules and also counts resolved failures.
Phase I progression looks encouraging. With only ten resolved Phase II assets in the earlier cohort, I would not infer that AI has improved molecules while leaving target selection unchanged.
Discovery costs and productivity
Even if Phase II success rates never move, these methods could still matter through fewer synthesis cycles, cheaper candidates, faster development, or programs that were previously infeasible. More approvals per research dollar is a different claim from a higher probability of success per program.
A 2010 cost model assigns a substantial share of per-launch cost to discovery: target-to-hit, hit-to-lead and lead optimization, before preclinical or clinical spending. Its authors note exclusions that make even that an undercount. These estimates should not be read as current costs.
In the sources reviewed here, I did not find a matched comparison reporting all of the following: comparable targets and candidate requirements, elapsed time, compound counts, failures, candidate quality and total spend. Comparing one surviving program with an industry average cannot isolate the method’s effect.
Structure-based design produces selective chemical probes used to test disease hypotheses. JQ1, a probe for BET bromodomain proteins, enabled pharmacological tests of an existing cancer hypothesis involving BRD4. The target’s link to cancer preceded the probe; the probe made it possible to test what happened when a compound blocked it.
Designed biologics, briefly
Biologics have a different evidence base. “AI-designed antibody” can mean generating a new molecule or optimizing an existing binder, and those are different contributions. For example, Generate:Biomedicines describes its clinical antibody GB-0895 as engineered with AI. That description alone does not say whether the molecule was designed from scratch.
Predicting an antibody and predicting how it binds its antigen are also different tasks. In one 2025 benchmark, AlphaFold3 produced a high-accuracy complex in about 10% of cases and an acceptable-or-better complex in about 35%.
SKYCovione provides an approved example of a computationally designed protein scaffold. The vaccine uses a self-assembling nanoparticle to display coronavirus antigens. Its Phase III trial demonstrated stronger antibody responses than an active comparator, and it received Korean approval in June 2022. Here the designed component was the scaffold that displayed the antigens.
What would change my assessment
The evidence is strongest for obtaining structures and finding useful compounds. To judge productivity and clinical outcomes, I would look for the following:
A matched workflow comparison. Comparable targets, candidate criteria and resources, with compounds synthesized, months elapsed, failures, candidate quality and total spend reported for each approach.
The high-novelty split, run on current models. Mattsson and Walters propose a benchmark intended to reduce target-mirroring shortcuts. Published results for Boltz-2 and IsoDDE on that split, with its novelty criteria clearly specified, would help establish whether their gains survive a stricter test.
Prospective selection and synthesis with the new models. Use Boltz-2 or IsoDDE to choose compounds before making them, then report the successes and failures against a comparable workflow. This would test whether the benchmark gains help chemists decide what to make.
A record of what the tools contributed. Record what each method did for each molecule, alongside target-novelty classifications, phase dates, failures and stated discontinuation reasons. That would support more specific comparisons than company identity can provide.
Larger clinical trials. Rentosertib’s Phase III should provide a stronger test of patient benefit. As more programs report, the useful comparison will require knowing which tools each program used, when it adopted them, and whether it began with a new target or an existing lead.